
To complement the panel and to address an important gap in analysis of Russia endurance in war, a gasoline dashboard and scenario lab was created at fuel.incidence.world.
It is free, no registration, English, Ukrainian and Russian, and runs entirely inside the browser. It opens fully populated: 33 refineries with capacities, units and regions, the strike record reconciled to 20 September with 44 damaging events, and the constants, each carrying its source and the direction in which that source is most probably wrong.
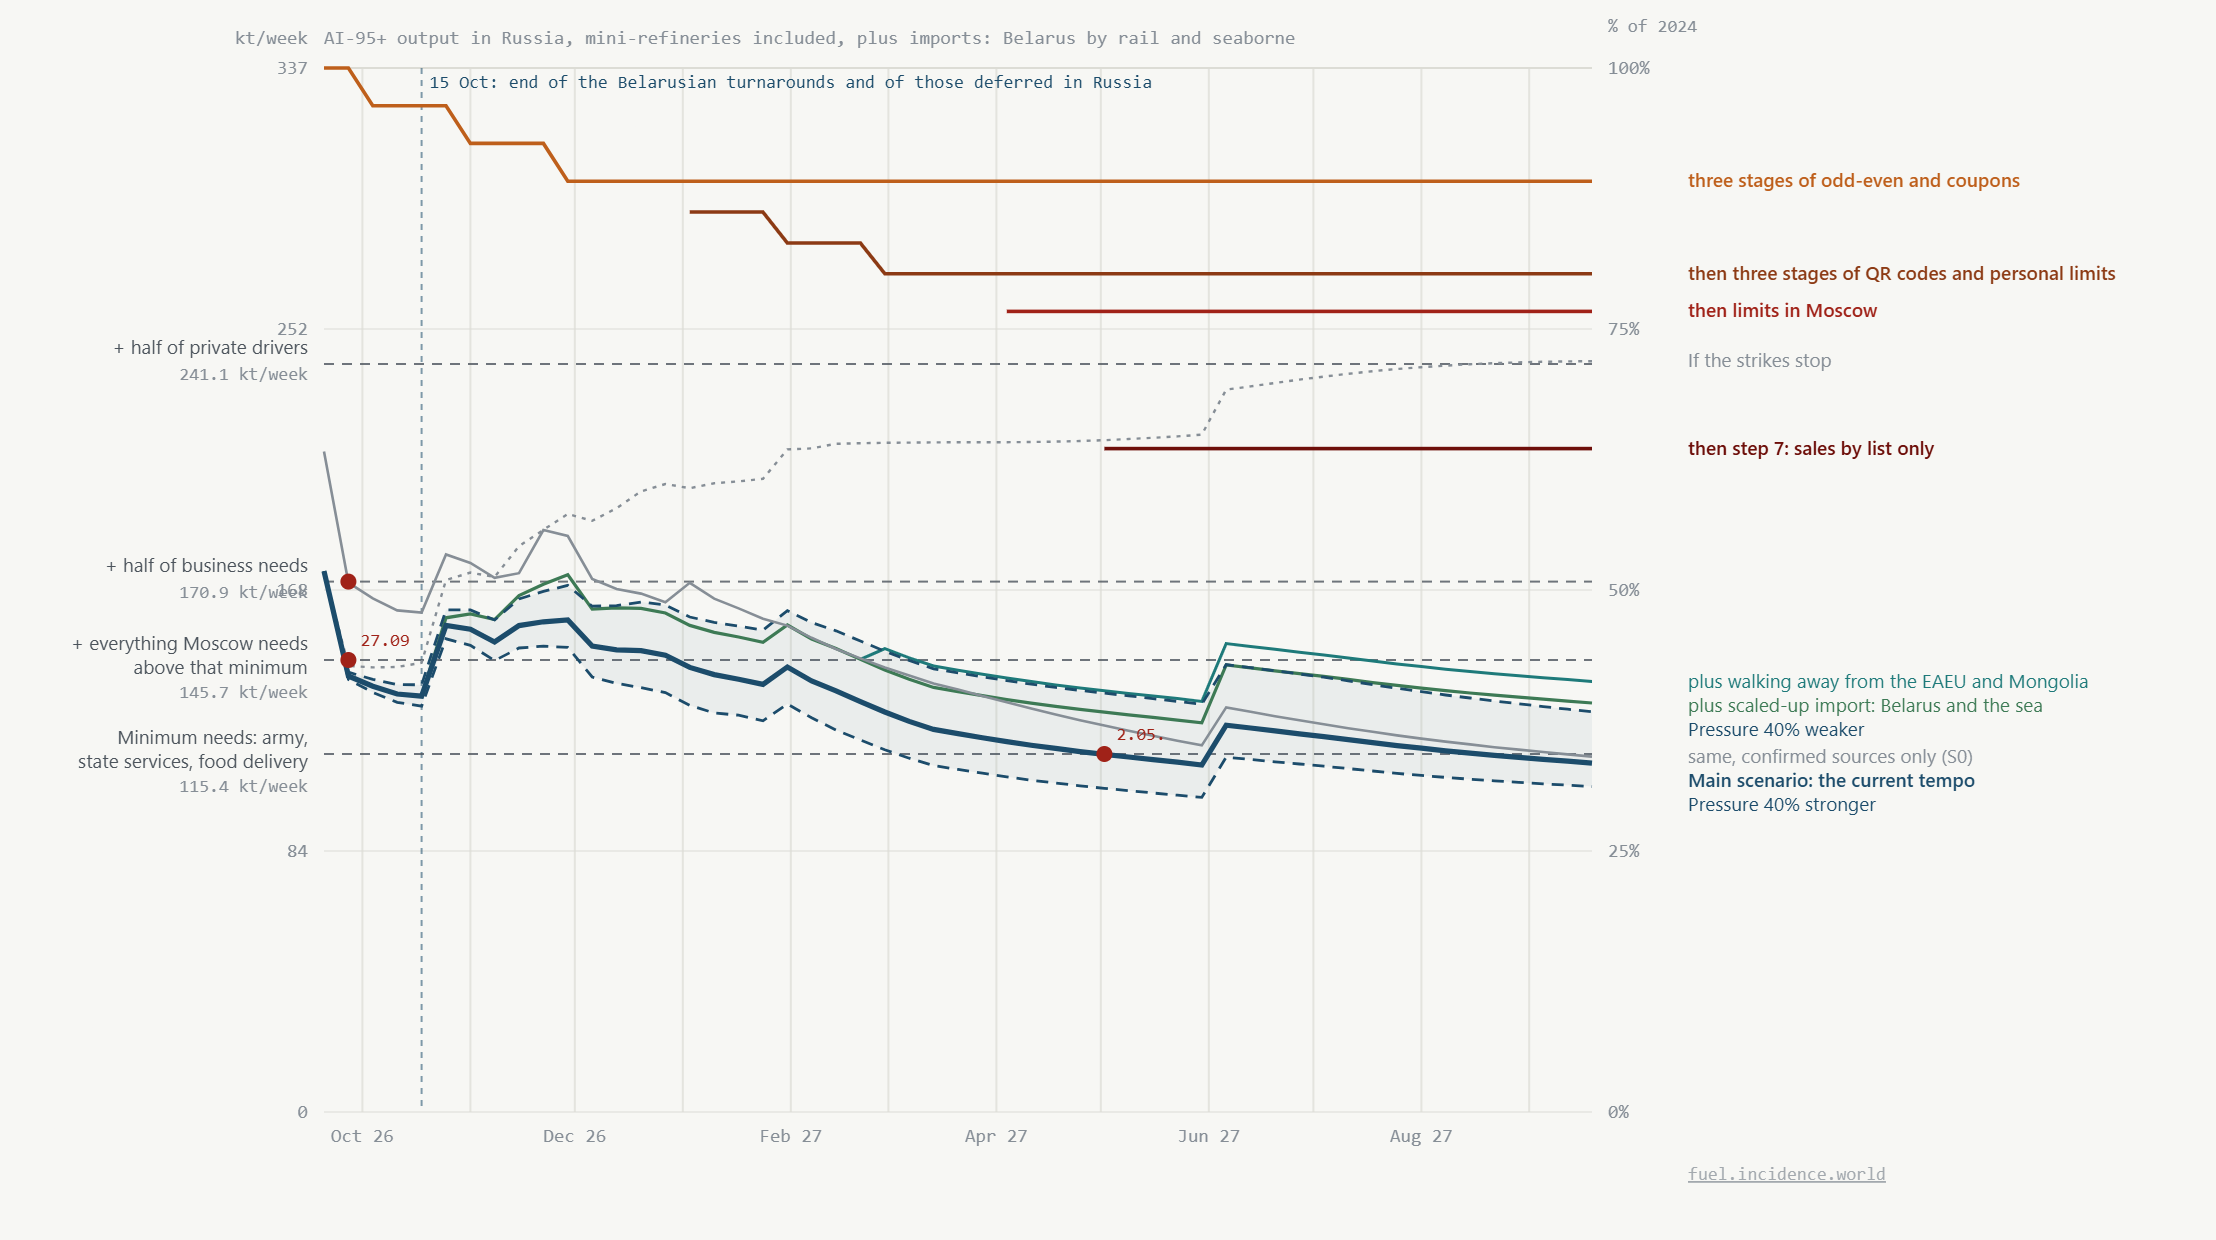
There is a heat map of where the damage sits, a flow diagram of where gasoline comes from and who receives it, and a twelve-month space of scenarios against the thresholds below which particular consumers stop being served.
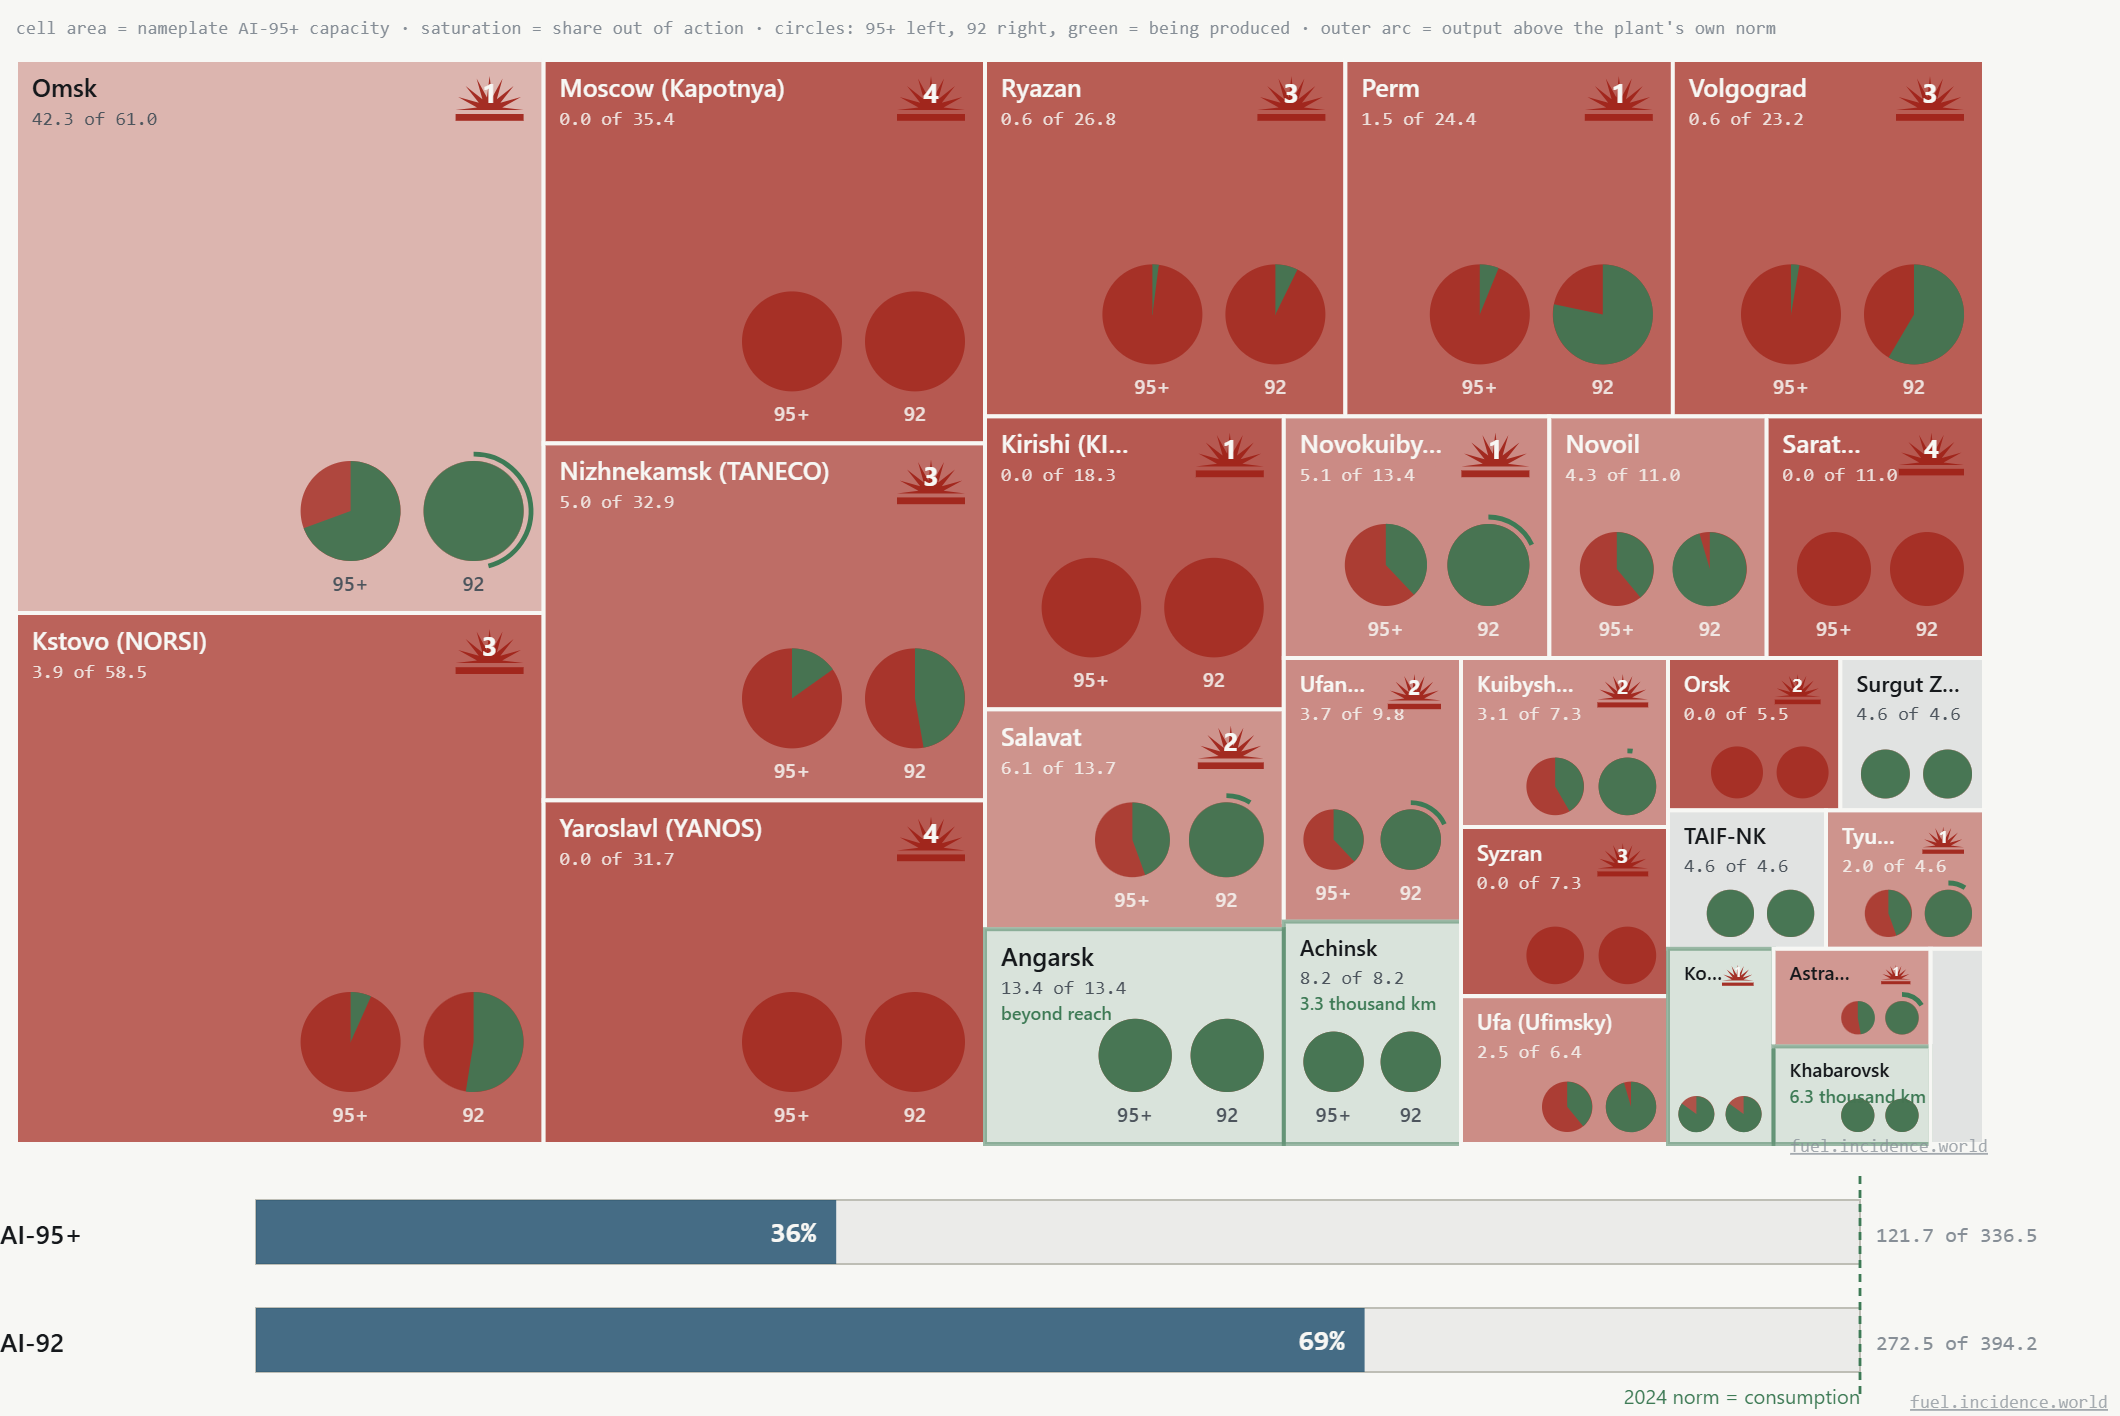
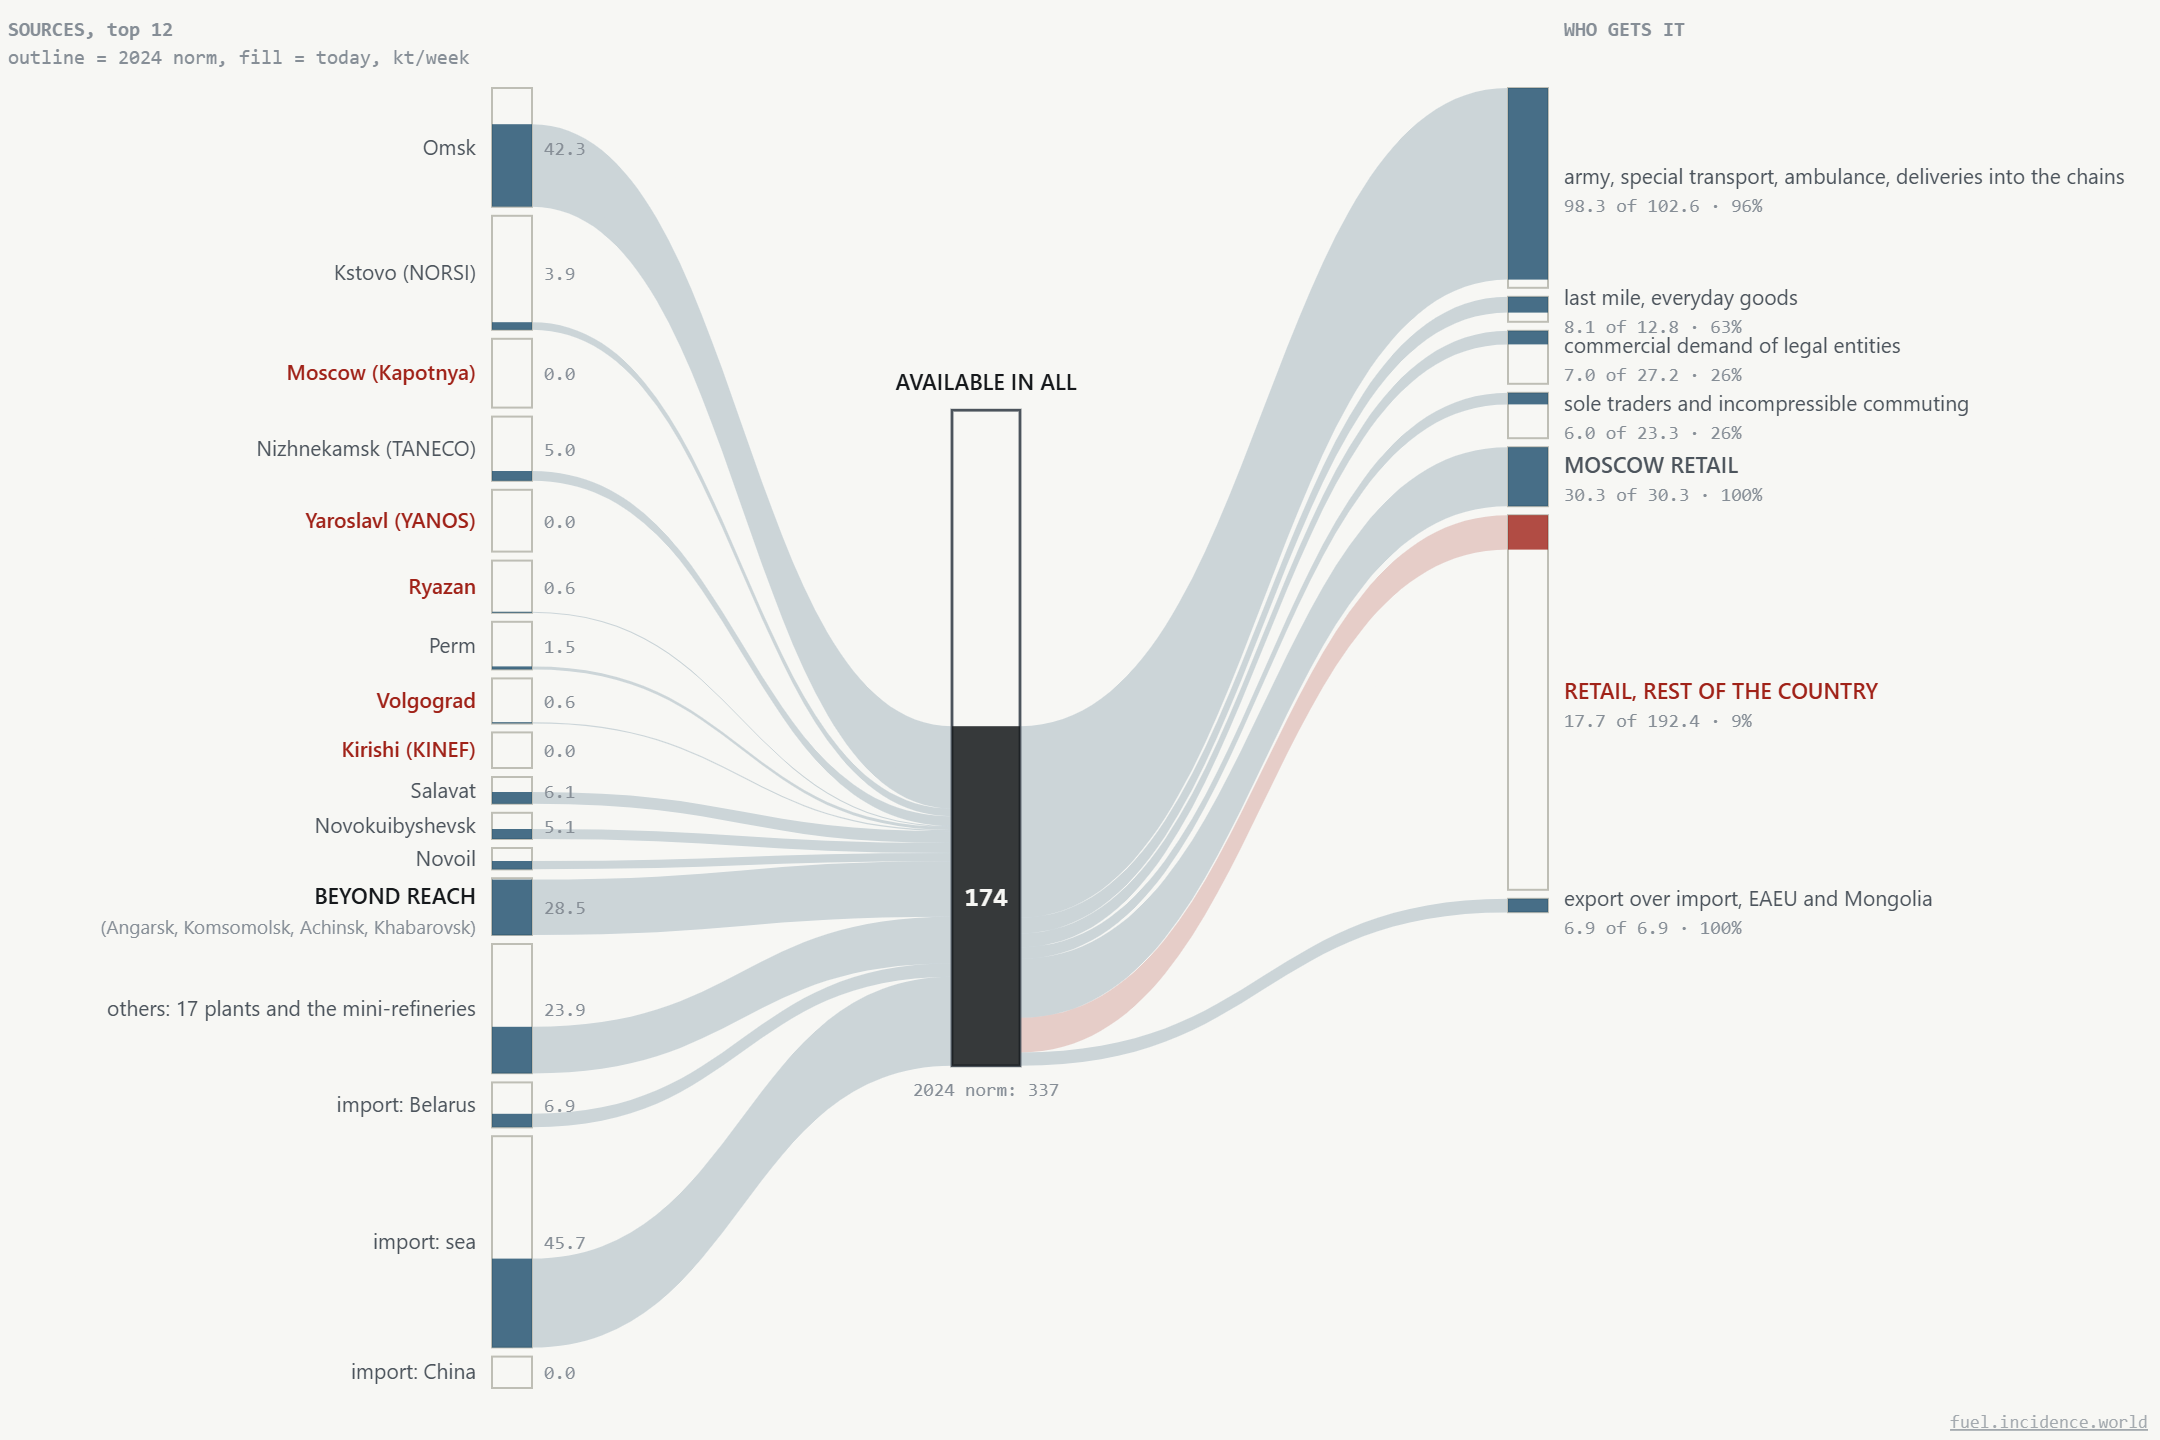
The Lab is also the engine room behind widget 1.3. (Petrol: administrative response ladder) of the panel Limits of Russian endurance in war at incidence.world.
Widget 1.3 was created to show what the regime was forced to do to respond to crisis, while the Lab was created to show what is forcing such response along with quantified consequences for up to 12 months at the same time predicting a moment when the next rung (and higher price to pay by Russia) becomes inevitable.
Both the Lab and the widget together provide another important measurement. When the Lab model predicts that the rung 6 is due while the Kremlin still holds at 5, it shows how much the Kremlin forces Russians to absorb (and thus pay for the war) through queues, prices and drawn-down reserves.
There is an important gap in how Ukrainian strikes on Russian oil refineries are monitored and analyzed.
For example, Reuters will report that Ryazan refinery lost AT-6 and AVT-4 equipment after Ukrainian strike on 6 September. Such reports are not connected to a model that tracks and predicts how much high-octane gasoline will be lost for Russia consumption in 1, 3 or 6 months. To calculate this a country-wide model is required which takes into account the equipment at each plant and tracks the race of damage versus repairment in such incomplete data environment with many uncertainties.
Another type of reporting is strike trackers which count strikes, sometimes equipment types and damage severity, but no thorough capacity aggregates or recovery projections, at best some aggregation is a rough automated approximation without important details taken into particularity. They glaring one is an ability of refineries with damaged high octane equipment to increase low-octane (AI-92) gasoline production.
Bloomberg and EA Analytics have upward bias: tanker traffic plus thermal imagery = a measure of activity, not of throughput, e.g. a “hot” equipment piece does not tell the mode of operation and amount it actually produces, tanker traffic can be used for storage or use previously stored barrels, not produced ones, and all such errors run upward.
The Lab is built to close exactly this step.
And it was also created for disagreement, experimentation, different scenarios probing. A plant can be set to a different state, and any of the eleven parameters can be moved within its stated range. An event card can be switched on, such as import financing, a strike moratorium or odd-even rationing. The model then derives what follows: station availability for AI-95+, the rationing ladder, coverage by region and by consumption tier, and the fiscal price of that bundle of assumptions.
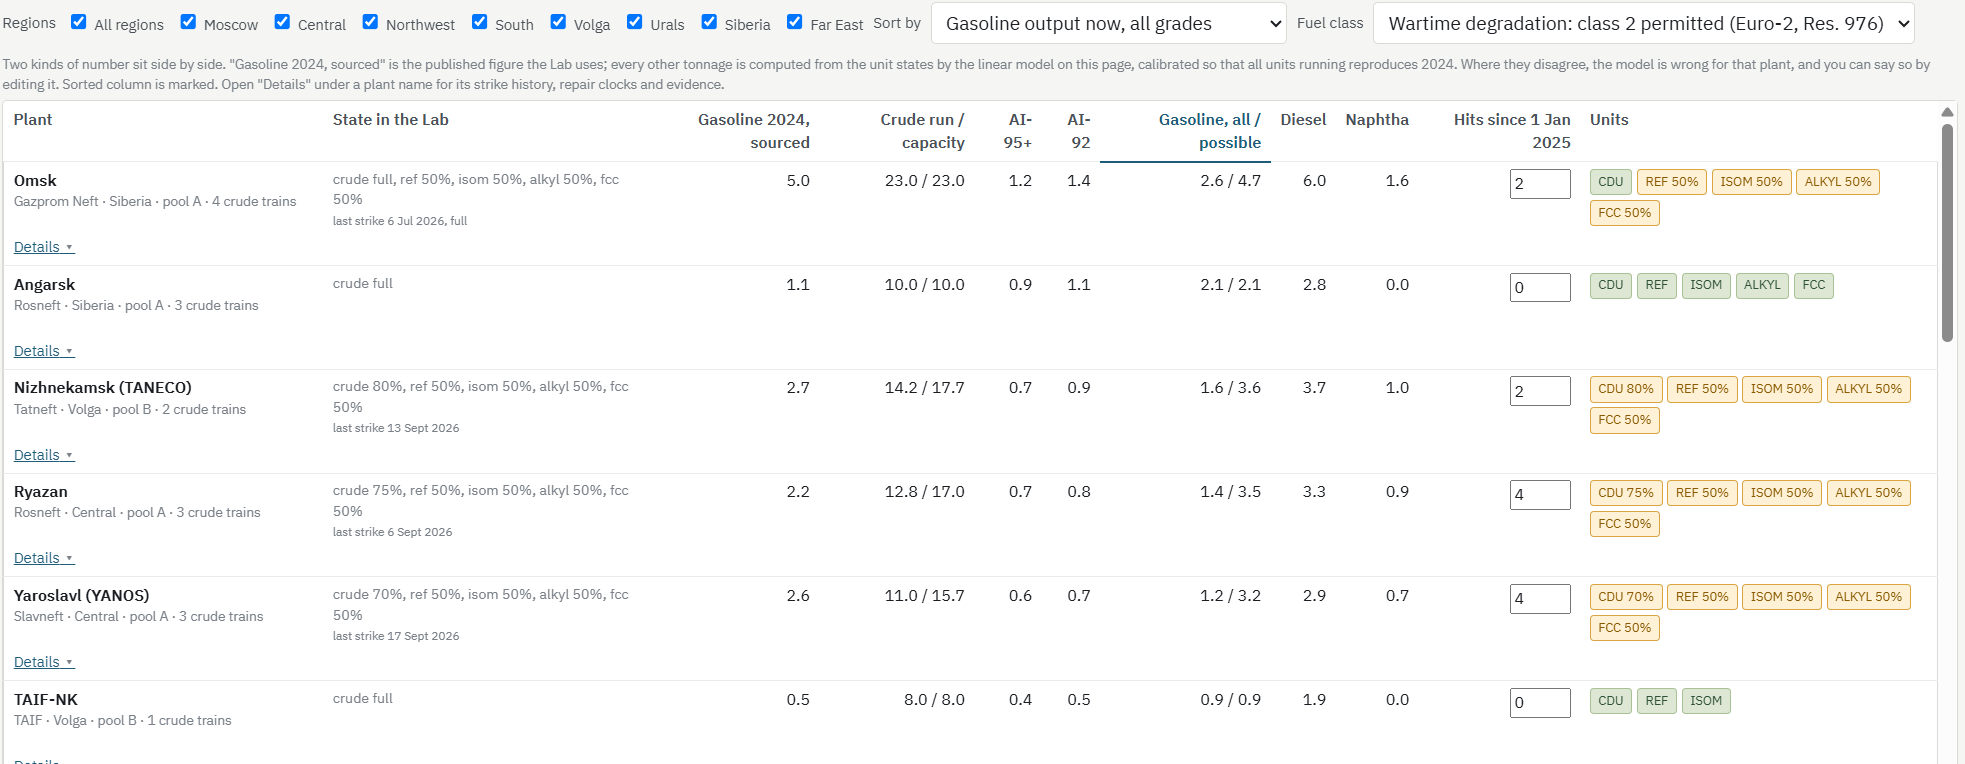
New strikes go in as they happen, one at a time or in a batch. The dialog asks what was observed, such as a named crude train stopped, a plant which stopped taking crude, or a reformer identified in imagery. It then applies a published rule to turn the observation into a share of capacity, showing the rule as it goes, so the argument is with the rule and not with an invented number.
Two gates test the result. One checks against observed availability at the pump. The other replays the campaign from May and checks that the model reproduces today’s damage. A scenario which fails either gate is marked as failing, on screen, rather than quietly fudged until it passes.
Today’s state is not a stored snapshot but a derivation: the last hand-reconciled anchor plus every recorded strike since, evolved through the model’s own repair rules. Restarts are never reported reliably, so they are modelled, and the gap between what the model expects and what the next reconciliation finds is published as drift. That gap tests the repair assumptions, the one thing here nobody can observe and everybody guesses at.
Incidentally, it also tests the one charitable reading of the Bloomberg and EA estimates, namely that their higher runs are not method bias but plants coming back faster than the repair rules allow. If so, the next reconciliation finds more capacity running than expected, and the drift line shows the model running low, on screen.
The point is not to publish a number but to publish a machine which produces numbers from assumptions that can be inspected, rejected and replaced, and which reports when it has failed its own tests. Anyone tracking strikes is invited to try to break it, to send events, or to add them directly.